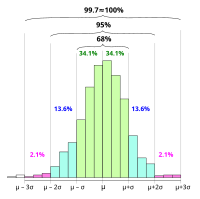
68–95–99.7 rule

The 68–95–99.7 rule is a way to visualize how data is spread out. It tells us that if we take a large group of data points, 68% of them will be within one standard deviation from the average, 95% of them will be within two standard deviations from the average, and 99.7% of them will be within three standard deviations from the average. So if we have a group of data points that are mostly close together, then it would be considered a normal distribution.
Related topics others have asked about:
