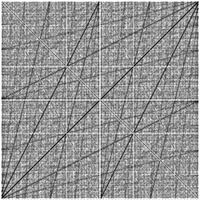
Bernoulli map

Imagine you are playing with a ball and a ramp. You place the ball at the top of the ramp and watch it roll down. The ball moves very quickly at first and then slows down as it gets closer to the ground. The speed of the ball depends on how high it is on the ramp.
Now, imagine instead of a ball and ramp, we have a line with some dots on it. We call this line the "Bernoulli map". Each dot represents a number between 0 and 1. We can make a rule that tells us where each dot should move to when we apply the map.
The rule we use is like this: if a dot is less than 0.5, we move it to twice its current position. If a dot is greater than or equal to 0.5, we move it to twice its current position and then subtract 1.
Let's say we start with a dot at 0.4. When we apply the map, we move it to 0.8 (twice the value of 0.4). Let's apply the map again and see where the dot goes. We move 0.8 to 0.6 (twice 0.8 minus 1). Applying the map again, we move 0.6 to 0.2. We can keep applying the map over and over to see what happens to the dot.
What we notice is that some dots will move towards 0 and stay there, while others will bounce back and forth between 0 and 1. This pattern is called "chaos" and it is what makes the Bernoulli map interesting to mathematicians.
So in simple terms, the Bernoulli map is like a game where we move dots on a line according to a special rule and see how they behave. Some dots stay put while others move wildly, making it an interesting topic for mathematicians to explore.
Related topics others have asked about:
