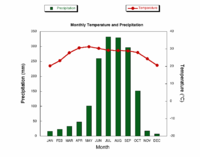
Climograph

Hey kiddo, a climograph is a special chart that shows you the average temperature and rainfall in a specific place over a year.
You know how sometimes it's really hot in the summer and really cold in the winter? Well, a climograph helps us see what the temperature is like throughout the whole year.
The chart has two parts. The first part is a bar graph that shows the amount of rainfall each month. Rainfall is how much rain falls from the sky in a specific area. This is important because some places get a lot of rain all year, while others get very little.
The second part of the chart is a line graph that shows the temperature throughout the year. Temperature is how hot or cold it is outside. This is important because it can affect what kinds of plants can grow and what kind of animals can live in that area.
Together, the climograph helps us understand more about a place's climate. Climate is the typical weather in a place over a long period of time. By looking at a climograph, we can learn about the climate in a specific place and how it might impact the plants and animals that live there.
