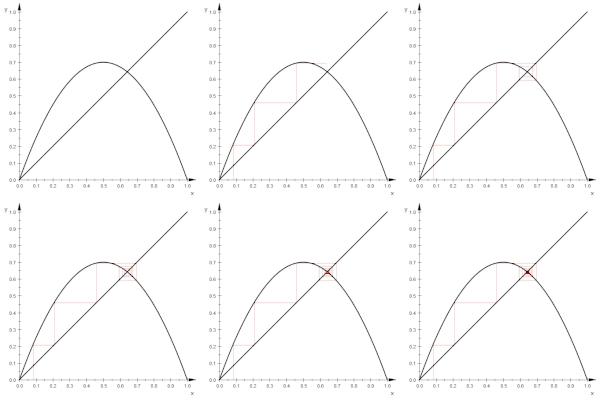
Cobweb plot

A cobweb plot is like a picture that helps us see how something changes over time. Imagine you love to draw, and you want to make a picture of a tree growing taller every year. You start with a dot at the bottom of the page to show how tall the tree is in the first year. Then you draw a line up to another dot that shows how tall the tree will be in the second year, using a ruler to make sure it's the right length. You keep doing this for many years, making dots and lines to show how tall the tree grows each year. When you're done, you can connect all the dots with a zigzag line that looks kind of like a cobweb, hence the name "cobweb plot."
People use cobweb plots to understand how different things change over time, like how many fish live in a pond or how much money a company makes. They start with some data from the past, like how much money the company made in the first year, and use that to make a dot on the cobweb plot. Then they use some rules to figure out how much money the company will make in the second year, and use that to make another dot and a line connecting the two dots. They keep doing this for many years, tracing out a zigzag line that shows how the company's profits grow or shrink over time.
Cobweb plots are like maps that help people see where things might be going in the future. If the line on the cobweb plot is going up, it means the company's profits are growing. If the line is going down, it means the company is struggling. By looking at the shape of the line, people can make predictions about what might happen next, like if the company will go bankrupt or if it will become very successful. So, in short, a cobweb plot is a visual tool that helps people see how things change over time and make predictions about the future.
Related topics others have asked about:
