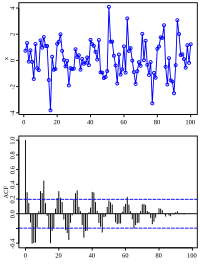
Correlogram

A correlogram is a picture we make to see if there is a pattern between two things. It's like if we try to find if there are any connections between the color of the ice cream we buy and the temperature outside.
To make a correlogram, we plot the values from one set of data on the x-axis and plot the values from another set of data on the y-axis. Then, we draw little dots (or bubbles) for each data point where the x and y values meet.
If we see a line of dots going up or down, it means that when one value increases, the other value tends to increase or decrease too. And if the dots are all over the place, it means that there isn't really a connection between the two things.
For example, let's say we plot the number of people who buy ice cream and the temperature outside. If we see a line of dots going up, that means that when the temperature outside gets hotter, the number of people buying ice cream increases. It's like the hotter it gets, the more people want ice cream. Cool, huh? That's how correlograms work!
