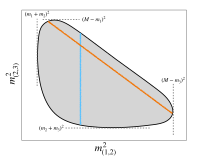
Dalitz plot

Okay, so imagine you have a bunch of marbles, and you want to see how they're moving around when they bump into each other. That's kind of like what scientists do with something called "particles" - really, really tiny things that we can't even see with our eyes!
When scientists study particles, they often use something called a "Dalitz plot". It's like a special kind of picture that shows how particles move around and interact with each other.
The Dalitz plot looks a bit like a graph. Along one side, you've got something called "x-axis", and on the other, you've got "y-axis". But instead of measuring ordinary things like distance or time, these axes measure something called "energy".
Particles have different amounts of energy, and when they bump into each other, they can swap energy around. The Dalitz plot shows how all of these energy exchanges are happening - kind of like watching the marbles bump into each other and seeing how they change directions.
Scientists use Dalitz plots to help them understand how particles work, and to come up with new ideas about how they might be able to use these tiny things to make cool stuff in the future!
