Kuznets curve

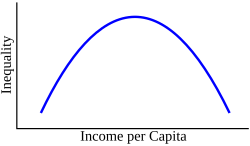
A Kuznets curve is a graph that shows how an economy changes over time. It usually looks like an upside-down U. On one end of the curve, people have low income levels, but as the economy grows, incomes start to go up, until they reach a peak. Then as the economy keeps growing, incomes start to go back down until they reach the same level as before. The idea is that when a country is starting out, it generally has lower incomes and more poverty, but as the economy grows and becomes more advanced, people start to have more money and have better lives.
