Moving average crossover
Alright kiddo, so you know how sometimes things can go up and down? Like your favorite toy might go up and down in popularity among your friends. Well, the same thing can happen to the price of something like a stock or a cryptocurrency.
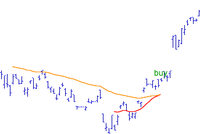
But grown-ups like to look at patterns to try and predict if the price will go up or down. One pattern they use is the moving average crossover. It's like drawing a line through the price over a certain time period, like a week or a month.
When the line starts going up, it means the price has been going up on average. When the line starts going down, it means the price has been going down on average.
Now, we look at two lines, one for a shorter time period and one for a longer time period. When the shorter line crosses over the longer line going up, it means the price has been going up more recently and that could mean it might keep going up.
And when the shorter line crosses over the longer line going down, it means the price has been going down more recently and that could mean it might keep going down.
So, grown-ups use moving average crossover to try and predict if the price will go up or down based on recent trends. Of course, nobody knows for sure what will happen, but this helps them make more informed decisions.