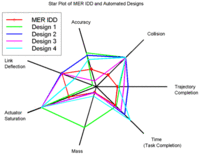
Radar chart

Do you know how you draw pictures in your class using different colors of marker pens? Imagine if you had to draw a picture that showed how good you are at different things like running, jumping, singing, and dancing. But instead of using colors, you have to use lines to draw the picture.
That's what a radar chart does! It helps you show how good you are at different things like a spider web. The center of the spider web is where you are not good at something and the outer edges of the web show where you are really good at something.
For example, if you are really good at running, the line you draw for "running" will go all the way out to the edge of the spider web. But if you are not so good at singing, the line for "singing" will be close to the middle of the spider web.
The radar chart is like a map of all your skills and talents that you can use to show to others how great you are at different things!
Related topics others have asked about:
