Residue curve

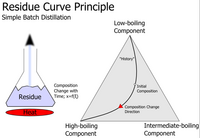
Residue curves are like a map that shows us what happens to a substance when it is being heated up and cooled down. Think of a pan of water on the stove. When we heat up the water, it starts to boil and turn into steam. This is because the water is changing from a liquid to a gas.
The same thing happens to other substances when we heat them up. For example, if we heat up a mixture of two chemicals, they might change from a liquid to a gas at different temperatures. We can use a residue curve to see how these two chemicals will behave when we heat them up and cool them down.
Residue curves are like a graph that shows us the temperature and pressure needed to turn a substance from a liquid to a gas. We can use this graph to predict how a substance will behave under different conditions. For example, if we know that a certain chemical will turn into a gas at a certain temperature and pressure, we can use this information to design a process to separate that chemical from other chemicals in a mixture.
So, to sum up, a residue curve is a graph that helps us understand how a substance will behave when we heat it up and cool it down. It helps us design processes for separating chemicals and other substances.
