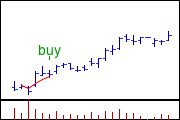
Rising moving average

Think of a moving average like a line that shows you the average of something over time. For example, if you wanted to know the average temperature in your town over the last 10 days, you could take the temperatures from each day and add them up. Then you could divide that total by 10 to get the average temperature over that period of time.
Now, imagine that you want to track a stock's price over time. You can use a moving average in the same way. You take the stock's price for a certain number of days (let's say 20) and add them up. Then, you divide that total by 20 to get the average price over that time period. As each new day passes, you take the average of the previous 20 days and add the price for the new day. Then you drop the oldest day's price from the calculation and divide by 20 again. This gives you a new moving average that takes into account the most recent 20 days of the stock's price.
When this moving average is rising, it means that the stock's price has been increasing consistently over the selected period of time. It gives you an idea of the trend the stock is following. For example, if a stock has a rising 50-day moving average, it means that the stock's price has been going up over the last 50 days, on average. This can be a helpful indicator for investors because it helps them get a sense of the stock's momentum and whether it might be a good time to buy or sell.
