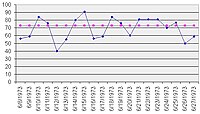
Run chart

Hi there little one! Have you ever heard of a run chart? It's like a fancy tool that helps people keep track of things they're measuring over time.
Let's say you're trying to keep track of how many vegetables you eat each day. With a run chart, you can make a line graph that shows how many veggies you ate each day over a period of time, like a week or a month.
This can be useful because you can see if you're eating more veggies on some days than others, or if there's a pattern to how many you eat over time.
Run charts can be used for lots of different things, like tracking hospital patient wait times, or measuring the speed of a manufacturing process. The goal is to make it easy to see how things are changing over time, so you can make adjustments if needed.
So, there you have it! A run chart is basically a tool to help people keep track of data over time by making a graph. It's like a super cool way of measuring and organizing things!
