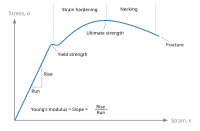
Stress-strain curve

Hello there! Today, we are going to talk about something called the stress-strain curve. Now, I know that might sound like a big, confusing words, but I promise to explain it to you like you are five years old!
Have you ever played with a rubber band? Did you notice how it stretches when you pull it and how it goes back to its original shape when you let it go? The stress-strain curve is kind of like that, but for different kinds of materials like metals or plastics.
When we stretch or squeeze a material, we put stress on it. Stress is like a force or pressure that we apply. And just like how different rubber bands have different levels of stretchiness, different materials have different levels of stress they can take before they start to break or deform.
The stress-strain curve shows us how much stress a material can take before it breaks or starts to deform. The graph has two axes, one for stress and the other for strain. Strain is like how much the material changes shape when we put stress on it.
When we start to put stress on a material, it starts to deform or change shape. The first part of the curve is when we put a little bit of stress and the material starts to stretch or squeeze a little bit but goes back to its original shape when we take the stress off. This is called the elastic region.
But after a certain point, if we keep putting more and more stress, the material can't go back to its original shape and starts to deform permanently. This is called the plastic region. And finally, when we put too much stress, the material breaks! This is called the fracture region.
So, to sum it up, the stress-strain curve shows us how much stress a material can take and how much it deforms before it breaks or starts to change shape permanently. It's like a map that tells us how strong or weak different materials are. Pretty cool, huh?
Related topics others have asked about:
