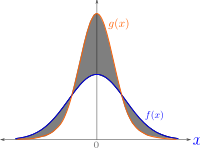
Total variation distance of probability measures

Imagine you have two bags of candy. One bag has mostly red candies, and the other has mostly blue candies. To measure how different the two bags are, you can count how many candies you need to switch from one bag to the other to make them look the same. That count is like the total variation distance between the two bags.
In math lingo, we call each bag a probability measure, which is just a way to assign a number between zero and one to each color (red or blue), where the sum of those numbers is always one. The total variation distance between two such measures is the largest difference between their assigned numbers for any given color.
For example, if the red bag has 80% red candies and 20% blue candies, and the blue bag has 30% red candies and 70% blue candies, then the total variation distance between them would be 0.5. That's because the difference between 80% and 30% is 50%, which is the largest difference between any color.
The total variation distance is a way to measure how different two probability measures are, and it's really useful in lots of different areas of math and science. It helps us compare things like the results of different experiments or the predictions of different models. But at its core, it's just like counting how many candies you need to switch from one bag to the other to make them look the same.
Related topics others have asked about:
