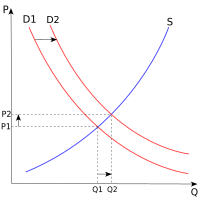
demand curve

A demand curve is a graph that shows the relationship between the price of something and how much of it people are willing to buy. It's shaped like a hill and shows that when the price of something goes down, people want to buy more of it, and when the price goes up, people want to buy less of it.
Related topics others have asked about:
