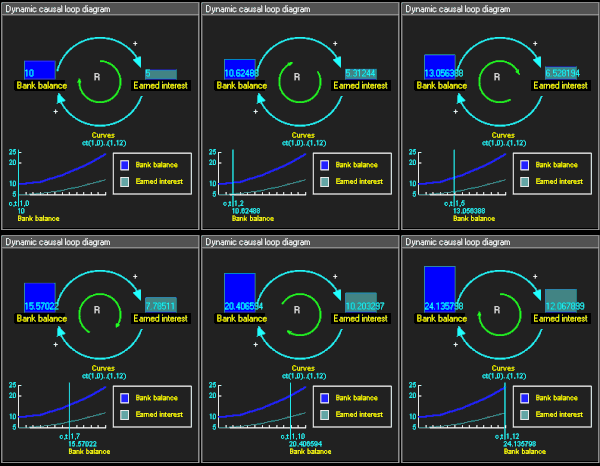
Causal loop diagram

A causal loop diagram is like a map or a drawing that shows how different parts of a system are related to each other. The diagram shows arrows connecting different parts and the arrows have arrows inside them to show that changes in one part can affect the other parts. It is like a picture of how things in a system can be connected and can influence each other.
Related topics others have asked about:
