Chord diagram (information visualization)
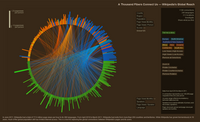
A chord diagram is like a picture that shows how different things are connected to each other. Imagine a circle with a bunch of pieces cut out of it, like a pizza but with more slices. Each slice represents something or someone, like your family members or different countries. The slices are called "nodes."
Now imagine lines connecting the different slices, like a spider web. These lines are called "chords." They show you how the different slices are connected to each other. So if one slice represents your mom and another slice represents your dad, the chord connecting them shows that they are married and have a special connection.
Chord diagrams are a way to help you see these connections more clearly. They can be used for lots of different things, like showing the relationships between different animals or the connections between different parts of the human body. They are a great way to understand complex information in a simple and visual way.