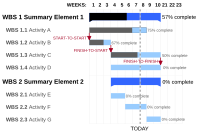
Gantt chart

A gantt chart is a type of chart that helps you keep track of how tasks are progressing. It's like a timeline that shows which tasks need to be done, when they should begin, and when they should finish. It also shows how long each task takes and any dependencies between different tasks. This kind of chart is often used in project management to make sure everything is moving according to plan.
Related topics others have asked about:
