Nichols plot
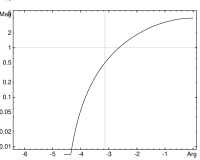
A Nichols Plot is a type of graph that helps us understand how electrical signals (like sound) behave when they travel through a system. To draw a Nichols Plot, you need to know two things: the gain (how much louder the sound gets) and the phase (if the wave of sound shifts in time). When you put the gain on the y (vertical) axis, and the phase on the x (horizontal) axis, you get a special kind of graph known as a Nichols Plot. The shape of the curve on the graph can tell us a lot of things, like how much of the sound gets lost, or if the wave of sound gets distorted. With this information, we can figure out how to improve the sound system, by adding more parts or changing the design.
Related topics others have asked about: