Nyquist plot
Imagine you love drawing and you want to draw a picture of how well a machine or system works. But instead of drawing it like a regular picture, you draw it in a special way that helps you understand how it works.
That's what a Nyquist plot is – a special kind of drawing that helps engineers and scientists understand how well a machine or system works.
To make a Nyquist plot, scientists measure how a machine or system responds to different frequencies. They then use those measurements to draw a special kind of graph that shows how the system behaves across a range of frequencies.
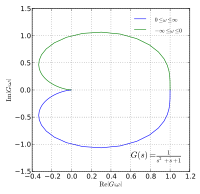
The graph has an imaginary x-axis and a real y-axis. Each point on the graph represents how the system behaves at a specific frequency. The scientists then connect these points to make a curve on the graph.
By analyzing this curve, the scientists can learn a lot about the system. They can see how fast the system responds to an input signal, and how much the system amplifies or reduces the signal. They can also see how stable the system is and whether it might have any problems.
So in summary, a Nyquist plot is a special drawing that helps engineers and scientists understand how well a system works by analyzing its response to different frequencies in a special graph.
That's what a Nyquist plot is – a special kind of drawing that helps engineers and scientists understand how well a machine or system works.
To make a Nyquist plot, scientists measure how a machine or system responds to different frequencies. They then use those measurements to draw a special kind of graph that shows how the system behaves across a range of frequencies.
The graph has an imaginary x-axis and a real y-axis. Each point on the graph represents how the system behaves at a specific frequency. The scientists then connect these points to make a curve on the graph.
By analyzing this curve, the scientists can learn a lot about the system. They can see how fast the system responds to an input signal, and how much the system amplifies or reduces the signal. They can also see how stable the system is and whether it might have any problems.
So in summary, a Nyquist plot is a special drawing that helps engineers and scientists understand how well a system works by analyzing its response to different frequencies in a special graph.
Related topics others have asked about: