Simple regression

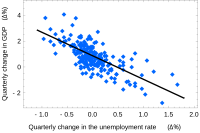
Okay kiddo, do you know what a graph is? It's like a picture of some numbers. When we want to see how two things are related, we can make a graph with a line that shows us that relationship. That line is called a regression line.
Let's say we want to know how many toys you get depending on how good you are at cleaning your room. We can make a graph with the number of toys on one side and how clean your room is on the other side. We could put little dots on the graph where your room is a certain level of clean and see how many toys you got at that point.
After we put all the dots on the graph, we can draw a line through them that shows us the relationship between how clean your room is and how many toys you get. This line is the regression line. It helps us see that the cleaner your room is, the more toys you get.
Simple regression just means that we only have one thing that we're looking at to see how it affects another thing. In our example, we're only looking at how clean your room is to see how many toys you get. We're not looking at any other factors that might affect how many toys you get.
So there you go, simple regression is just using a graph with a line to see how one thing affects another thing.
Related topics others have asked about:
