Spectrogram
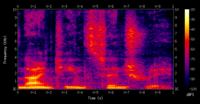
A spectrogram is like a picture of sound. It shows what sound looks like over time, with the loudness of different frequencies (or pitches) represented by different colors. The brighter the color, the louder the sound. A spectrogram is a tool scientists, musicians, and audio engineers use to better understand and make use of the sound they are working with.
Related topics others have asked about: