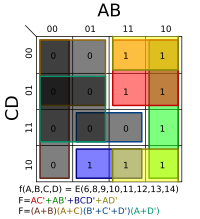
Veitch chart

A Veitch chart is like a picture that helps to organize information. It's useful for seeing relationships between different events or facts. To make a Veitch chart, you start by writing out the different events or facts that you want to compare. Then you draw boxes for each event and use lines and symbols to connect them in different ways. The lines and symbols help to show how the events or facts are related. Veitch charts can be useful for planning out things like a project, or to see cause and effect relationships.
Related topics others have asked about:
