Elbow method (clustering)

The elbow method is like trying to find the perfect way to organize your toys into different groups. Instead of toys, we have a bunch of data points that we want to group together based on how similar they are.
Imagine you have a bunch of hats with different colors and shapes. You want to group these hats together based on their similarities. To do this, you need to decide how many groups you want to make, also known as the number of clusters.
Now, let's say you start by trying to group all of the hats that are red together in one cluster, and all of the hats that are blue together in another cluster. But that might not be the best way to group them. Maybe you want to group them based on their shapes instead.
So, you try grouping the hats by their shapes. You start with one group for hats that are round, and another group for hats that are square. But again, that might not be the best way to group them. Maybe you need to try different numbers of clusters to see which way works best.
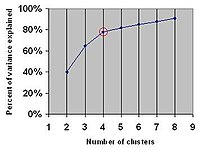
That's where the elbow method comes in. You plot the number of clusters on the x-axis and the total distance between the data points and their cluster center on the y-axis. The total distance is calculated using a mathematical formula.
When you plot this graph, it looks like a line that starts high and gradually decreases as you increase the number of clusters. But at some point, the line starts to be less steep and looks like an elbow.
This elbow point is the number of clusters where adding more clusters doesn't significantly reduce the distance. You want to find the elbow point because you want to create clusters that are as different from each other as possible, but also as similar as possible within each cluster.
So, the elbow method is just a way of visually finding the best number of groups or clusters to group your data points together based on their similarities and dissimilarities.
Related topics others have asked about:
