Scree plot
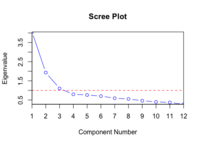
Scree plot is a graph that helps us understand which features or variables are most important in a set of data. It is like a picture that shows us how much information we get from different parts of the data. We can think of the data as a big puzzle, and the scree plot helps us see which pieces of the puzzle are the most useful.
Imagine you are playing with a lot of toys, and you want to know which toys you like the most. You can make a list of all the toys and rate them on a scale from 1 to 10. The scree plot would be like a graph that shows you which toys you gave the highest rating to. The toys that got the highest ratings would be at the top of the graph, and the toys that got lower ratings would be at the bottom.
Looking at the scree plot can help you decide which toys to keep playing with and which ones to put away. You might find that some toys are not very fun, and you don't need to play with them anymore. On the other hand, some toys might be very important to you, and you want to spend more time with them.
In the same way, scree plot helps us figure out which parts of the data are most important. This can be helpful if we want to make predictions or understand patterns in the data. We can use the scree plot to guide us in focusing on the most important information and ignoring the less important information. And just like with toys, we can decide which parts of the data to keep exploring and which ones to leave behind.
Related topics others have asked about: