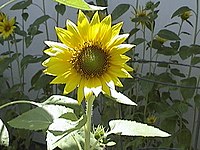
Image histogram

An image is made up of different coloured pixels. An image histogram is like a big graph that shows how many pixels of each colour (shade) are in the picture. Imagine you have a big jar of jellybeans - the image histogram is like counting how many of each colour jellybean you have and making a big graph to show the results.
The horizontal axis of the histogram represents the different possible shades or colours in the image, and the vertical axis shows how many pixels have that shade. So, a tall bar on the graph means you have a lot of pixels with that shade, and a short bar means you have fewer pixels.
Histograms are useful because they can help you to adjust the image's brightness and contrast, make sure your picture doesn't have any overexposed or underexposed areas, or identify certain objects or features in an image that might otherwise be hard to see. Kind of like using a map to find where you want to go!
Related topics others have asked about:
