Pie chart
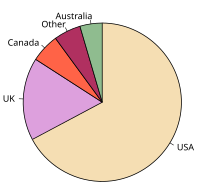
A pie chart is a circular chart that represents data or information. Imagine you have a big yummy pizza and you want to see how much of it is made up of different toppings like cheese, pepperoni, mushrooms, and sausage. You could cut the pizza into slices and make a pie chart to show how much of each topping is on the pizza.
The pie chart is divided into sections, or slices, that each represent a part of the whole. In our pizza example, each slice would represent a different topping. The size of each slice depends on how much of that topping is on the pizza. If there's lots of cheese on the pizza, the slice representing cheese would be big. If there's only a little bit of sausage, the slice representing sausage would be small.
Pie charts are a great way to visualize data because they show how different parts make up a whole. They're easy to read and understand, even for little kids! They can also be used to compare different sets of data, like if you wanted to see how much of each topping was on two different pizzas. Just draw a pie chart for each one and compare the sizes of the slices.
Related topics others have asked about: