Probability distribution
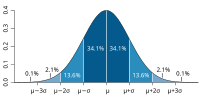
A probability distribution is like a graph. It shows us how likely something is to happen. For example, if we were looking at a graph of how likely it is to get a number between 1 and 10 when we roll a dice, it would look like a bell shape. The top of the bell shape would be the most likely number (in this case it would be 7). That makes 7 the most probable number that we would get when we roll the dice. The numbers further away from 7 would be less probable and show up less often when we roll.
Related topics others have asked about: