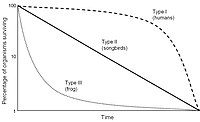
Survivorship curve

A survivorship curve is a graph that shows us how many organisms in a population survive over a certain period of time. It can help us understand how well an organism is able to survive and thrive. For example, if we know that only 10% of a species of bird survived for five years, we can see that this species of bird is not doing very well in terms of survival. The graph might look like a big hill that starts high and then decreases over time, showing us the percentage of birds that are still alive after different lengths of time.
Related topics others have asked about:
