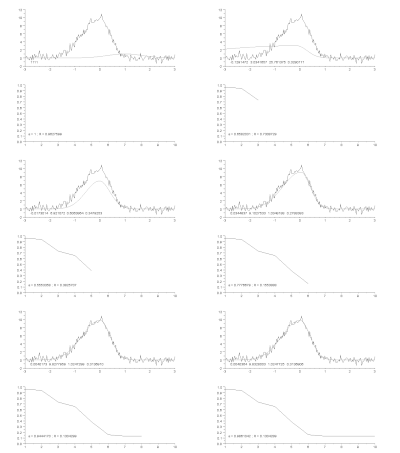
Function fitting

Imagine you have a collection of toys, and you want to put them in a box. The problem is, the box is too small to fit all the toys perfectly. You could try cramming them all in, but that might not work very well.
Function fitting is kind of like figuring out the best way to fit all your toys in the box. Instead of toys, though, we're talking about numbers or data. Maybe you have a list of numbers that represent information about something, like how many people bought ice cream each day this week. You could try to put these numbers into a graph, but it might not look very nice or make sense.
So, what do we do? We use math to "fit" a function to the data. A function is like a set of instructions that takes in a number and returns another number. We can use a function to describe the pattern of our data.
For example, let's say our ice cream sales numbers look like this:
Monday: 20
Tuesday: 22
Wednesday: 25
Thursday: 21
Friday: 23
Saturday: 30
Sunday: 35
We could try to fit a function to these numbers to describe how sales are increasing. One common function for this is a linear function, which means the sales increase by the same amount each day. The function might look like this:
y = mx + b
Where y is the number of sales, x is the day of the week (1 for Monday, 2 for Tuesday, and so on), m is the slope or rate of increase, and b is the y-intercept or starting point. We can use some fancy math to find the best values of m and b that fit our data.
Once we have this function, we can use it to predict how many sales we'll have on any given day. We can also use it to make our graph look nicer and easier to understand.
Function fitting is a really useful tool for understanding patterns in data and making predictions. It's kind of like putting all your toys neatly in a box so you can see them all at once!
Related topics others have asked about:
