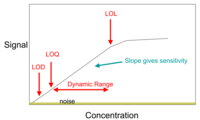
Calibration curve

Imagine you have a ruler but you are not sure if it measures accurately. So, you ask a grown-up to help you check it. They use another ruler that they know measures accurately, and they compare the two rulers to see if they match up. This is called calibration.
A calibration curve is kind of like a ruler comparison. Scientists use it to make sure their equipment measures things accurately too. So, let's say they want to measure the amount of sugar in a drink. They first need to make sure their equipment is measuring accurately.
To do this, they make a known solution of sugar and measure it with their equipment. They do this several times using different amounts of sugar in the solution. Each time they measure, they get a number. They plot these numbers on a graph and connect them with lines. This is the calibration curve.
Now they can use this calibration curve to measure the sugar levels in the drink accurately. They put the drink in their equipment, and it gives them a number. They look at the calibration curve to see what the actual sugar level is based on the number they got from the equipment.
So, a calibration curve is like a comparison chart that helps scientists measure accurately every time they use their equipment to measure something.
Related topics others have asked about:
