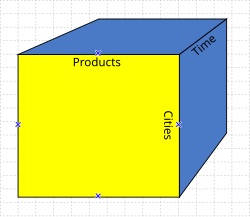
OLAP cube

An OLAP cube is like a special kind of block toy that helps grown-ups organize and understand big piles of information.
Imagine you have a tower made up of different kinds of blocks – red blocks, blue blocks, and green blocks. Now, imagine you also have a wall made of little squares – each square has a different number written on it.
To make sense of all these blocks and numbers, you could take your tower apart and sort the blocks into piles by color. Then, you could take the squares and sort them into piles by the number they have written on them.
But what if you want to know how many red blocks you have for each number square? Or how many green blocks you have for each blue block? That's where the OLAP cube comes in.
The OLAP cube takes all this information – the blocks and the numbers – and puts them together in a special way so that you can easily "slice and dice" the data.
The cube has different layers or dimensions, like a cake. Each layer represents a different aspect of the data. For example, one layer might be the color of your blocks, another layer might be the numbers on the squares, and a third layer might represent the height of the tower.
Depending on what you want to know, you can "slice" the cube by selecting two or three layers, and then "dice" it by filtering or drilling down into the data.
For example, if you want to know how many red blocks there are for every number square, you would slice the cube by selecting the layer for color and the layer for numbers, and then dice it by filtering out all the other colors besides red.
In this way, the OLAP cube lets you organize and analyze large amounts of data in a way that's easy to understand and use.
Related topics others have asked about:
