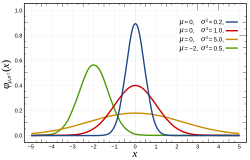
normal distribution

Normal distribution is like a bell-shaped curve. It is a way of showing data. The middle of the curve is the most common data number, and the numbers further away from the middle are less common. This can help us figure out data about things like a person's age, height, weight, or test scores.
Related topics others have asked about:
